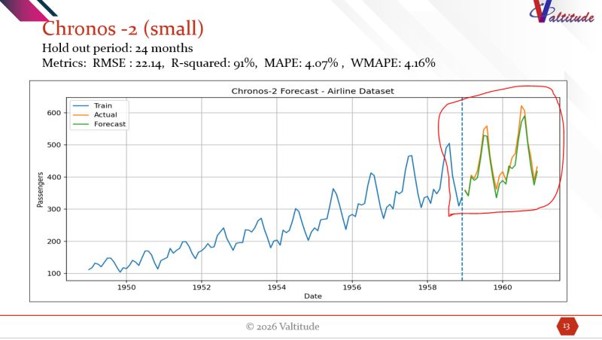
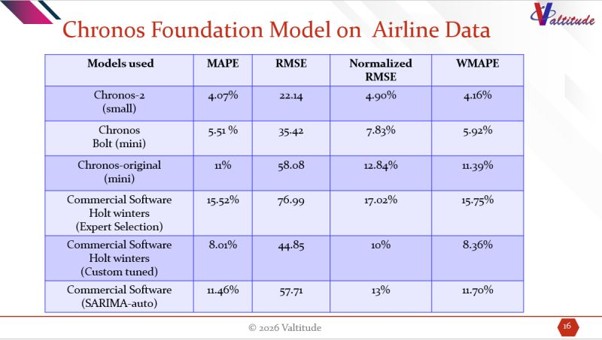
Forecast Error Benchmarking Across Various Industry – Survey Results

we started conducting the survey across supply chain and demand planning professionals from various industries. This survey was meant to compile information about their pain points, forecast error metrics they use, industry they work for, and who owns the demand planning function. We are publishing the first installment of the results from this survey in this newsletter.

As expected one of the metrics used by 52% of the respondents is WMAPE or volume weighted MAPE, calculated as Sum of Absolute errors divided by sum of actual demand.

Is Statistical Modeling an After thought?

I have been preaching Usability for the past few years.

Put together fine tools – But help the users in making the transition to the tool – give them better understanding – Make the new tool more usable!

Give them the reports they need. Provide them an exception based workflow!

APO has good statistical models. They will help you move the peanut forward but only if they are understood and leveraged.

We just re-launched the marketing campaign for our Usability Consulting. Model tuning and model matching to product profiles are important elements of the Usability training.

Once implemented the Usability project will harmonize the use of models across planners from various geographies for the same business/product family. There will be streamlined work flow.

Moving The ROC To Forecast…….

Start with the forecast first and make plans and contingencies for the extent of the error. Improve on the forecast by quizzing, dialoguing, negotiating and working with the ROC. This should be well emphasized in the basics of supply chain management.

Join hands together to move the ROC to make a better demand plan!